(Millions of yen)
| Year Ended March 31, 2019 | Year Ended March 31, 2020 | Year Ended March 31, 2021 | Year Ended March 31, 2022 | Year Ended March 31, 2023 | |
|---|---|---|---|---|---|
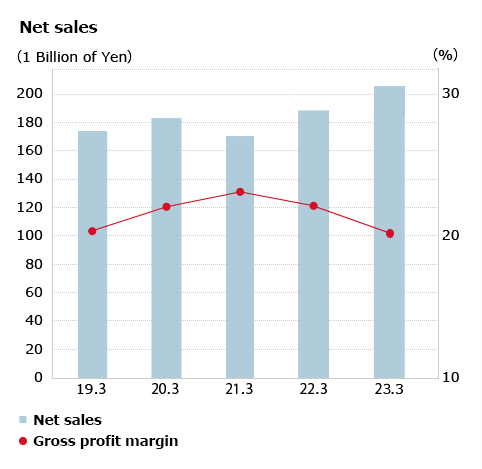
| Net sales | 170,759 | 181,232 | 169,573 | 187,018 | 207,589 |
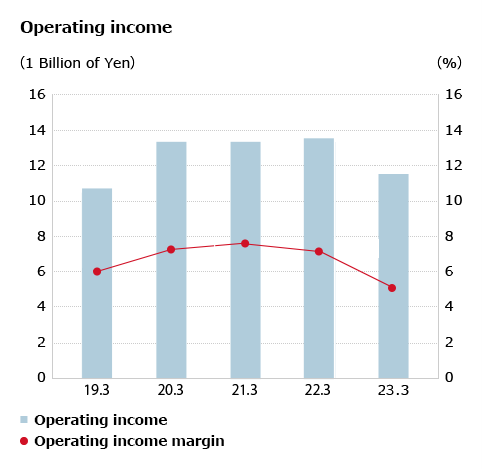
| Operating income | 10,313 | 13,375 | 13,288 | 13,777 | 11,619 |
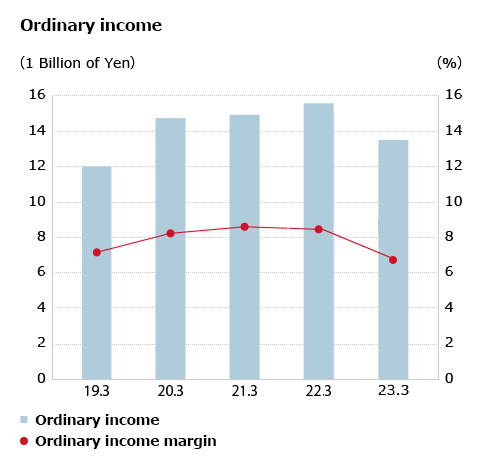
| Ordinary income | 11,922 | 14,682 | 14,633 | 15,713 | 13,332 |
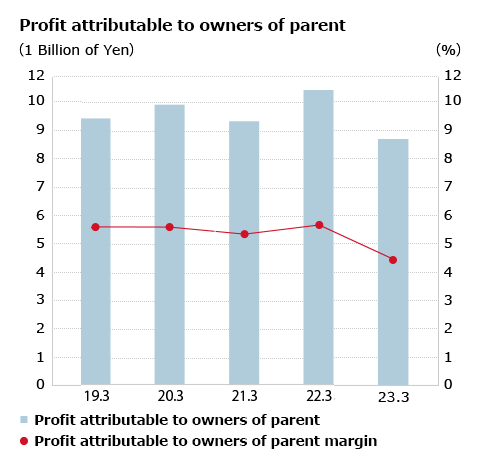
| Profit attributable to owners of parent | 9,220 | 9,916 | 9,287 | 10,835 | 8,433 |
| Net assets | 113,923 | 118,714 | 125,264 | 140,482 | 144,118 |
| Total assets | 184,690 | 193,581 | 205,196 | 220,609 | 230,098 |
| Interest-bearing debt | 4,116 | 4,901 | 3,720 | 4,505 | 11,886 |
| Shareholders' equity ratio(%) | 55.7 | 55.2 | 54.8 | 56.9 | 55.6 |
| Cash flows from operating activities | 9,589 | 11,078 | 21,542 | 9,846 | △2,346 |
| Cash flows from investing activities | -2,160 | -4,341 | -7,955 | -3,994 | 1,949 |
| Cash flows from financing activities | -4,198 | -3,800 | -5,866 | -6,520 | △10,670 |
| Free cash flows | 7,429 | 6,736 | 13,586 | 5,852 | -397 |
| Cash and cash equivalents at end of year | 25,902 | 28,181 | 35,840 | 39,042 | 31,463 |
| R&D expenditures | 2,425 | 2,208 | 2,121 | 2,662 | 2,590 |
| Capital investment | 2,912 | 3,523 | 2,831 | 4,088 | 4,527 |
| Number of employees (persons) | 10,105 | 10,292 | 10,423 | 10,683 | 11,453 |
| Net income per share(yen) | 114.14 | 122.46 | 114.52 | 133.42 | 106.67 |
| Diluted net income per share(yen) | 114.07 | 122.40 | 114.46 | 133.36 | 106.62 |
| Net assets per share(yen) | 1,271.28 | 1,318.59 | 1,385.45 | 1,549.83 | 1,640.29 |
| Cash dividends per share(yen) | 45 | 50 | 60 | 70 | 75 |
| Return on shareholders' equity (ROE) (%) | 9.1 | 9.5 | 8.5 | 9.1 | 6.7 |
© 2022 FUJITEC CO., LTD.
